Visualising Mill Road

Lisa Koeman and Vaiva Kalnikaite’s project of Visualising Mill Road has made both local and national news by featuring in the Cambridge News and on the BBC News website.

Mill Road, Cambridge is divided by a train bridge and the project looks at how each side relates to their community.

The aim of the project is to assess community interaction and satisfaction.  Through the use of electronic key pads, Lisa Koeman and Vaiva Kalnikaite are trying to determine local’s feelings about their community in a North/South divide.  This is then displayed on the pavements outside the shops in graffiti format.  18 shops along the road have taken part in the project and you can read more about it in the news or on the website www.visualisingmillroad.com

St Andrews Summer School

From 8 July until 12 July, Lisa Koeman attended the SICSA Big Data Information Visualisation summer school at the University of St Andrews. The week was aimed specifically at PhD students, and just over 30 applications were selected. The attendees came from a number of countries and had a variety of backgrounds, including human-computer interaction and statistics.

The summer school had an initial focus on theory, with an increasing amount of practical work. The theoretical part consisted of talks by Professor Peter Triantafillou (University of Glasgow), Professor John Stasko (Georgia Tech) and Professor Sheelagh Carpendale (University of Calgary), among many others.

Not only were practical topics covered, including introductions to Hadoop and various visualisation tools, but also a more general background on small, medium and big data, programming models, network visualisation and interaction.

All attendees were assigned to groups, based on their interest in the different available datasets – which included Skyscraper flight data, UK migration data, the Enron mail corpus and various others. After a short introduction to the data, a sketching session was organised by Professor Sheelagh Carpendale, to allow each group to explore different methods of visualising.

The remaining part of the week was spent on the implementation of the visualisation ideas and final presentations were given to a jury on the last day of the summer school. The consensus among the attendees seemed to be that the week had been very intensive, but more importantly: very productive. A valuable experience, of great relevance to the work done on data analysis and visualisation by us at the ICRI Cities.

(Photo by Professor Aaron Quigley)

In their pursuit of a “natural” or “intuitive” interaction, researchers and designers in Human-Computer Interaction have created a multitude of post-WIMP (post-“Windows Icons Menu Pointer”) user interfaces and interaction techniques during the recent years. Examples range from “perceptual computing” with depth cameras for gesture/body tracking and simultaneous pen & multi-touch interaction to tangible displays for augmented reality or entire rooms equipped with display walls and interactive tables.

The workshop “Blended Interaction – Envisioning Future Collaborative Interactive Spaces” at CHI 2013 in Paris on Apr 28 that was organized by Christian Jetter with colleagues from Konstanz, Dresden, Edinburgh, St. Andrews and Hagenberg (see http://hci.uni-konstanz.de/blendedinteraction2013/) established “Blended Interaction” as a novel concept for understanding what makes interactive technologies “natural” or “intuitive”. In brief, “Blended Interaction” combines the virtues of physical and digital artifacts, so that desired properties of each are preserved while integrating computing power in a considered manner. In a world of Blended Interaction, computing is woven into the fabric of our natural physical and social environment (e.g. our cities) without being too obtrusive or disruptive.

Keynote speakers Robert Jacob (Tufts University), Michel Beaudouin-Lafon (Université de Paris-Sud) and Andy Wilson (Microsoft Research) gave exciting and inspiring talks about the theory, technology and vision of Blended Interaction. During the workshop, Christian also presented his vision of future self-organizing user interfaces that would be particularly appropriate for interacting in rapidly changing physical and social environments and usage contexts such as cities (slides: http://hci.uni-konstanz.de/downloads/blend13_jetter_slides.pdf, paper: http://hci.uni-konstanz.de/downloads/blend13_jetter.pdf).

ws1 ws2

Johannes Schöning (ICRI Cities, UCL & Hasselt University) and Hans-Christian Jetter (ICRI Cities, UCL) were invited to the European Commission’s Joint Research Centre (JRC) at Ispra, Italy for attending a workshop in the European Crisis Management Laboratory of the Institute for the Protection and Security of the Citizen (http://old.gdacs.org/cr/ECMLWorkshops/BigWallHCI/JRC-ECML-BigWallHCI-Workshop-Programme_FINALv3LQ.pdf).

ispra

A view into the European Crisis Management Laboratory.

Johannes and Christian presented their vision of collaborative interactions in future crisis rooms together with Harald Reiterer and Simon Butscher from the University of Konstanz. In a joint presentation they showed how different designs and technologies from their research in the field of Human-Computer Interaction and Information Visualisation (e.g., collaborative tangible search on tabletops, folding views and lenses for collaborative geographical visualization, user identification and hand tracking using RGB and IR cameras, curved displays) can be used to enable multi-user geospatial analysis of real-time data, e.g., twitter feeds.

ispra2

Different components for future crisis rooms developed by the University of Konstanz, University of Hasselt and UCL.

There was a lively exchange with the 40 workshop attendants from civil protection agencies, industry and academia about ideas and visions for future multi-user interaction with large displays in different application scenarios. For the research at ICRI Cities the event was particularly interesting to learn more about the many different data sources, sensor networks and simulation tools that are currently in use by civil protection practitioners to monitor, analyse, make sense and report about critical incidents on a global, regional or urban scale. By letting the workshop take place in the actual crisis room that is used to provide the President of the European Commission with situation reports, there was the opportunity to get a first-hand experience of typical tasks, tools and challenges. The inspiring event that was organized by Markus Rester from the Crisis Monitoring and Response Technologies (CRITECH) group at the JRC helped us to generate novel ideas about how to make data and simulations from a connected city accessible to analysts, policy makers, practitioners or city dwellers in a future “urban observatory”.


Netmob, a small conference dedicated to the study of mobility and network datasets (primarily sourced from mobile phones, although a couple of Foursquare based studies managed to sneak in), took place at the beginning of May at the MIT Media Lab. These kind of massive behavioural datasets paint a picture of human dynamics at an unprecedented level of detail, at city scale and beyond, and have proven invaluable for research in social sciences, statistical physics (of human behaviour), urban planning and computer science alike. Despite the fact that no official proceedings are published, other than a book of abstracts (pdf 40MB) and the D4D book (pdf 122MB), the quality of work was high, perhaps due to the big names on the organising committee.

The first day was a special session for the Orange D4D challenge in which around 150 teams of researchers tackled a wide range of development related problems using the anonymised and aggregated digital traces of 5 million Orange mobile customers in Cote d’Ivoire. It was great to see that Orange seem genuinely excited to be taking a lead in the ‘data philanthropy’ agenda, although they were also clearly concerned that research based on large scale personal data be conducted in a responsible manner, lest data sharing and extracting its value become politically and commercially impossible. For example, they urged researchers to be careful not to attract ‘big brother’ accusations, however misguided they may be, and to be sure to understand the local context before reaching potentially sensitive conclusions (e.g., do community detection algorithms reveal tribal divisions or merely economic regions?). UN Global Pulse also had a large presence at the conference, and were extolling the huge potential of large scale data analysis to help tackle global development issues – exciting times for the data scientist. Below I summarise some personal highlights of the work presented at D4D and Netmob.

Data 4 Development

In “AllAboard: a system for exploring urban mobility and optimizing public transport using cellphone data” Berlingo et al. (prize winners) develop a number of techniques for inferring public transport trips from people’s movement between cell towers (passive crowdsourcing), which is then fed into a system which optimises the transit network. This kind of system could potentially be applied to any city in the world, even more easily in cities that already capture trips with automated fare collection systems, such as London. However, an important consideration is that public transport routes are often planned in order to encourage trips in order to bolster activity in certain regions. Indeed, the network structure and cost of public transport will largely determine the OD matrix, so optimising based solely on existing flow patterns may not be enough.

In “Crowdsourcing Physical Package Delivery Using the Existing Routine Mobility of a Local Population”, McInerney et al. propose a novel method of package delivery which exploits people’s regular travel patterns. Taking inspiration from work on mobile ad-hoc networks, mobility data is analysed to determine the best path between participants to get a package to its destination, with minimal disruption to the participants route.

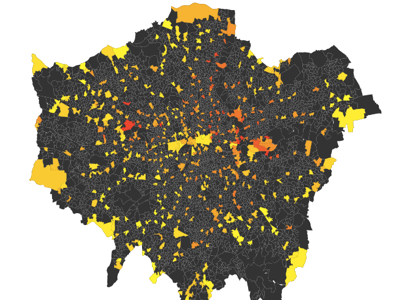
Mao et al. present a number of interesting findings including discovering a number of features of call activity that correlate with socioeconomic indicators around economic centres. Particularly interesting are correlations with the Gini coefficient, a measure of income inequality. They also find that a community detection algorithm delineates customers along boundaries between wealthier and poorer areas. In my own submission with Afra Mashadi and Licia Capra (which was mentioned as a ‘significant project’) we took a similar approach to mining the call data, and found a number of features which correlated strongly with poverty levels in different parts of the country. We then demonstrated how this might be used to produce poverty maps at a finer level of granularity.

First prize winners Lima et al. made full use of both communication and mobility patterns in “Exploiting Cellular Data for Disease Containment and Information Campaigns Strategies in Country-Wide Epidemics”. By comparing simulations of information diffusion over the communication network and infection spread over a physical contact network, they showed that information campaigns may be a more effective means of disease containment and prevention than physical quarantine efforts.

Mobility Modelling

The next two days of Netmob contained a lot of other interesting work using different data sets. Yang and Gonzales presented an extension to the radiation model of human mobility which includes a parameter to account for different scales. They showed that it performs better than the original radiation model and the doubly constrained gravity model, which has many more parameters to fit. Deville et al. showed that a simple scaling relationship exists between the exponents of mobility patterns and spatial-social networks, meaning that we could estimate the flow of traffic between areas from the flow of communication. An example of GPS mobility traces was given by Horanont et al., this time looking at visitor numbers in Japan. A nice 3D visualisation shows the numbers of visitors per building in the Odaibo area of Tokyo, something that certainly couldn’t be measured from CDR alone. Most haunting however, was an animation depicting the effect on mobility of the 2011 earthquake. The familiar flashes of movement across the city abruptly halted as the quake struck. Then individuals could be seen making long and slow walks home before the public transport network finally came back online late at night.

Crowdsensing

Salnikov and Lambiotte presented a brilliant example of incentivised crowdsensing in “Late For Good”. Smart phone users are offered a convenient service which automatically fills and submits delay claim forms to the Belgian rail operator in return for passively submitting regular GPS coordinates. Thus, what users lose in battery life, they gain in compensation and satisfaction. So far they have received around 600k data points, far from the billions often found in call detail records (CDR) datasets but with substantially increased spatial and temporal resolution.

Well-being

Back to Cote d’Ivoire but using data from a mobile operator other than Orange (and therefore not part of the D4D challenge), Gutierrez et al. present what might be known as the ‘top-up’ model of wealth. The reasonable, but as yet unvalidated, hypothesis is that top-up behaviour reflects the wealth of the phone user (i.e., frequent small top-ups = poor, infrequent large top-ups = rich). Using the model to produce a proxy wealth indicator they map the average and diversity of wealth of different regions in the country. The final (and to my knowledge, original) example of using CDR to map wealth/poverty at the conference came from Frias-Martinez et al. who presented “CenCell”. This is a system that takes as input, for a sample of census areas, ground truth socioeconimic level indicators and numerous mobility, social, and usage features of CDR data, and applies some advance machine learning techniques to build a classification model which can produce estimates for the remaining census areas. Posed as a binary classification problem (i.e., predict high or low socioeconomic level) and tested on data from a Latin American country the system was able to achieve up to 76% accuracy. Blumenstock and Toomet present an interesting study of ethnic segregation in cities, in the specific case of Estonia, which has a long history of in- and out-migration of Russians. Using language as a reliable proxy for ethnicity they are able to look in detail at social homophily and physical segregation, and more importantly the effect of migration and urbanisation on community integration.

Connected by Location

Toole et al. looked at the similarity between people’s movement patterns and how this similarity relates to social relations. Among their findings are that tie strength correlates with movement similarity and that individuals tend to share their most important locations with their top four social contacts. This means that movement similarity could be used as a proxy for a social network. Along similar lines, but this time using Foursquare data, Brown et al. develop a place-based model of social network formulation in cities, inspired by Feld’s theory of focused organisation which says that friendships often form around common foci. Their model reproduces many structural characteristics of real social networks. It is nice to see that a model based on location preference has similar results to those using mechanisms such as preferential attachment. It would be interesting to see if this approach was better at reproducing spatial characteristics of social networks such as aggregated tie strength between neighbourhoods within cities. This may also be significant for urban planners who want to think about the effects of the physical structure on promoting healthy social relationships.

Temporal Dynamics

Finally, Miritello et al. looked at medium-term temporal dynamics of communication patterns and produced several important results (see this blog post with visualisations and link to full paper). Notably, they found a high rate of decay among social ties – only 60% of a month’s social ties are present in the next month – meaning that a long period of observation (at least 6 months they suggest) is needed to gain an accurate picture of social relationships. Likewise, this means that a long period will be required to gain an accurate picture of flows between different parts of the city. They also found that individuals have a limited and fixed capacity for communication (although it differs between people), and reveal a distinction between ‘social keepers’, who maintain a fixed set of contacts, ‘social explorers’, who replace old contacts with new over time, and ‘social balanced’, whos rate of link birth/death is proportional to their capacity. Unexpectedly, simulations show that social keepers receive information in the network first, and given the connection between information diffusion and economic advantage, these new temporal properties of social networks may prove useful in modelling the well-being of neighbourhoods.

CHI_2013_Personal_Informatics_workshop

Prior to the main ACM SIGCHI Conference on Human Factors in Computing Systems, more commonly known as CHI, a variety of related workshops were held in Paris. Lisa Koeman took part in the Personal Informatics in the Wild: Hacking Habits for Health & Happiness workshop after her submission ‘Enabling Foresight and Reflection: Interactive Simulations to Support Behaviour Change’ was accepted.

The two-day Personal Informatics workshop was held at the Université Paris Dauphine and started off with 4-minute presentations from all attendees. Here, I presented the concept of ‘foresight’: the explicit visualisation of predictions. Such foresight can offer people insight into the consequences behaviour changes will have in the future. Current personal informatics tools mainly focus on providing users with visualisations of their previously collected data. Combined with goal-setting, (dis)incentives, and competitions or comparisons with other users, it is hoped users will become or remain motivated to change. Supporting people by enabling them to explore the effects of theoretical or actual behaviour changes has so far remained unexplored. If and how foresight can help will be addressed in the project around creating Interactive Visualisations of Urban Lifestyles.

The topics addressed by the attendees varied greatly, ranging from discussions on the ethical issues around persuading users, to designing a well-being monitoring application for residents of an elderly home. A complete listing of accepted papers can be found on the workshop’s website.

Following the presentations, the remaining time was spent on a “hackathon”. In the weeks before the workshop, groups were formed, and equipment of choice could be ordered (Arduinos, heart rate monitors, Jawbones, etc.). Groups were free to focus on any topic around personal informatics and deliverables of the workshop could range from paper prototypes and presentations to working applications.

My group focused on the issues around the long term usage of personal informatics tools, and how systems should adapt to both the individual’s setting and the time course of use. After filling up whiteboard after whiteboard with ideas, and exhausting all available post-its, we ended up creating a ‘Family Informatics Model’. We are planning to continue working on this idea, as will no doubt many of the other groups. The final workshop day ended with group presentations and a meetup at Quantified Self Paris for those interested. Despite flaky WiFi connections and a power outage, the Personal Informatics workshop proved to be a productive and very inspiring get-together.

My workshop submission can be found here and my presentation here.

DSCN7753

Sarah Gallacher has been getting some hands-on experience of what it’s like to be a user of London’s shared bicycle scheme “Barclays Cycle Hire” (BCH).

I was pretty nervous about cycling through the streets of London and to be honest I imagined I would stay in and around the parks for most of the day, so that’s where I headed first, for a cycle through Hyde Park.  The weather was gorgeous, the path was pretty quiet and it was great fun.  I spoke to several people at the docking stations who all happened to be tourists.  Like me, they were nervous of the roads and hadn’t ventured outside the parks.

However, my confidence had grown slightly and I felt I needed to experience cycling in London streets so I headed over to the back streets of Mayfair where I found a docking station on a quiet road.  I checked the map on the docking station terminal and picked out a route that would take me to another station a short distance away.  (I should point out that I was going for an offline experience.  I wasn’t using any apps to help me and perhaps if I had my user experience would have been different?)  Picking a route from the terminal map was difficult – the map didn’t show the one-way road system and it was hard to gauge how busy/quiet a particular route might be.   However, even though I was a little anxious my first street cycle was great!  Much more fun than cycling around the parks – if only the tourists knew!

By the afternoon my confidence had grown even more and I was taking much longer trips, from Holborn to Kings Cross and from Borough to Embankment.  It was addictive and I felt empowered knowing that I had just traveled across London by my own steam.  However, there were a few anxious moments, usually when I got lost or diverted from my planned route.  On one occasion I took a wrong turn and ended up going through Victoria Embankment tunnel (a fast two lane section of road with no turn offs or pavement)!  Not where I wanted to be on a leisure bike that wouldn’t go much faster than 10mph.  On several other occasions I had to dismount and push my bike along the pavement or over a pedestrian crossing because I’d come across a busy or complex road junction.  Some en-route guidance would have been really useful.  Yes, there are routing apps available but it’s almost impossible to consult those apps mid-cycle without pulling over (if you can).

There was also the element of time that was always in the back of my mind.  The bikes are only free to hire for the first 30 minutes of a journey.  If you don’t re-dock within 30 minutes you get hit with additional charges and indeed I spent several frantic minutes near Kings Cross Station desperately trying to find a docking station before my time ran out.

Later in the afternoon, I ran into a few of the BCH guys who redistribute the bikes around the docking stations (to ensure that none stay empty or full for too long).  I witnessed hundreds of bikes being stock piled at Stonecutter Street in Holborn ready for the evening commuter demand.  I also chatted to a guy who was removing bikes from an already pretty empty docking station at Waterloo.  Confused, I asked him why he was taking bikes away when there were so few left.  He said it was to prepare for the evening influx of commuters coming from the city centre.

All in all I had a very enjoyable day.  There were a few technical difficulties (unable to dock/undock bikes) and despite the best efforts of the BCH redistribution guys, I sometimes had trouble finding a free docking point at my destination (incidentally, I had no problems finding a free bike).  However, I loved cycling through the streets; taking in the city of London from a new perspective.


large_3986380908

Last Friday, February 22nd, Mara Balestrini joined the workshop “How Scary are Smart Cities” organised by The Edge and hosted at Buro Happold in London.

The aim of the session was to develop a shared sense of what smart cities might mean across the whole spectrum of city experience, evaluate risks and opportunities as well as question the role of technology in smart city deployments and projects.

The organisers invited a broad group of specialists ranging from architects to technologists, social scientist, engineers and urban planners, to share ideas within three different tracks: 1. To what question is smart the answer; 2. Learning and governance; and 3. the interplay between physical and virtual systems.

An average of four 10 minute presentations shared main issues regarding each of the topics proposed in the tracks. Organised in round tables, guests had the opportunity to debate on the ideas presented by the speakers and posit new questions or conclusions.

Alan Patrick posted an excellent review on the debate, focusing on the take-away themes, about the art of the possible and the emerging boundaries that came out during the event.

Some of the key issues discussed had to do with the importance of adopting a citizen-centric approach so as to seize the excitement over the benefits of technology. How can we make sense of all the data being constantly sensed by fixed and mobile sensors? Who owns the data and with which purposes? How sustainable is smart?

Mara’s presentation focused on shifting from Mark Weiser’s paradigm of calm technologies to a new approach where technologies are active tools aimed at helping citizens to make better decisions. She proposed that a bottom up approach towards creating smart solutions to sustainability problems should take into consideration those citizen-driven initiatives which are currently taking place in the urban space.

Other speakers such as David Saxby and Jayne Hiditch also discussed the power of the crowds as a key issue in the current zeitgeist. In general, the debate was successful in addressing the multiplicity of perspectives and themes that interweave in the still premature umbrella of smart cities. An inspiring day to prove that we still have many more questions than accurate answers.

photo credit: asterix611 via photopin cc

cscw2013

Chris Smith et al. will present a full paper at CSCW 2013. The paper is “Finger On The Pulse” is on identifying deprivation using transit flow analysis.

“A common metaphor to describe the movement of people within a city is that of blood flowing through the veins of a living organism. We often speak of the ‘pulse of the city’ when referring to flow patterns we observe. Here we extend this metaphor by hypothesising that by monitoring the flow of people through a city we can assess the city’s health, as a nurse takes a patient’s heart-rate and blood pressure during a routine health check. Using an automated fare collection dataset of journeys made on the London rail system, we build a classification model that identifies areas of high deprivation as measured by the Indices of Multiple Deprivation, and achieve a precision, sensitivity and specificity of0.805, 0.733 and 0.810, respectively. We conclude with a discussion of the potential benefits this work provides to city planning, policymaking, and citizen engagement initiatives”

geochi

We would like to invite you to submit to our workshop GeoHCI 2013 at CHI next year in Paris. GeoHCI 2013 aims to provide a much needed venue for members of the human-computer interaction and geography communities to create and share knowledge on topics that span this disciplinary boundary.

For the increasing number of HCI researchers and practitioners whose work has a geographic component, GeoHCI 2013 will offer a unique opportunity to discuss best practices and open research questions with like-minded members of the HCI community and with geographers, whose field has a rich understanding of spatial phenomena.

For geographers, GeoHCI 2013 is a chance to do the same with experts in HCI-related areas such as online communities, mobile and online maps, location-based social networks, crisis informatics, ubiquitous computing, and augmented reality.

Researchers and practitioners in HCI, geography, and related disciplines who are interested in participating should submit a two-page position statement as described in the call for papers. Position statements are due January 11, 2013 and should be submitted through this EasyChair site. The workshop, co-located with CHI 2013 in Paris, will be on April 27.

More information: http://geohci2013.grouplens.org/